[TWS 3.5.1 | GRA 8.3.4] Wie ein Grafana Panel reproduzieren?
Verfasst: Do Dez 01, 2022 11:35 am
Hallo,
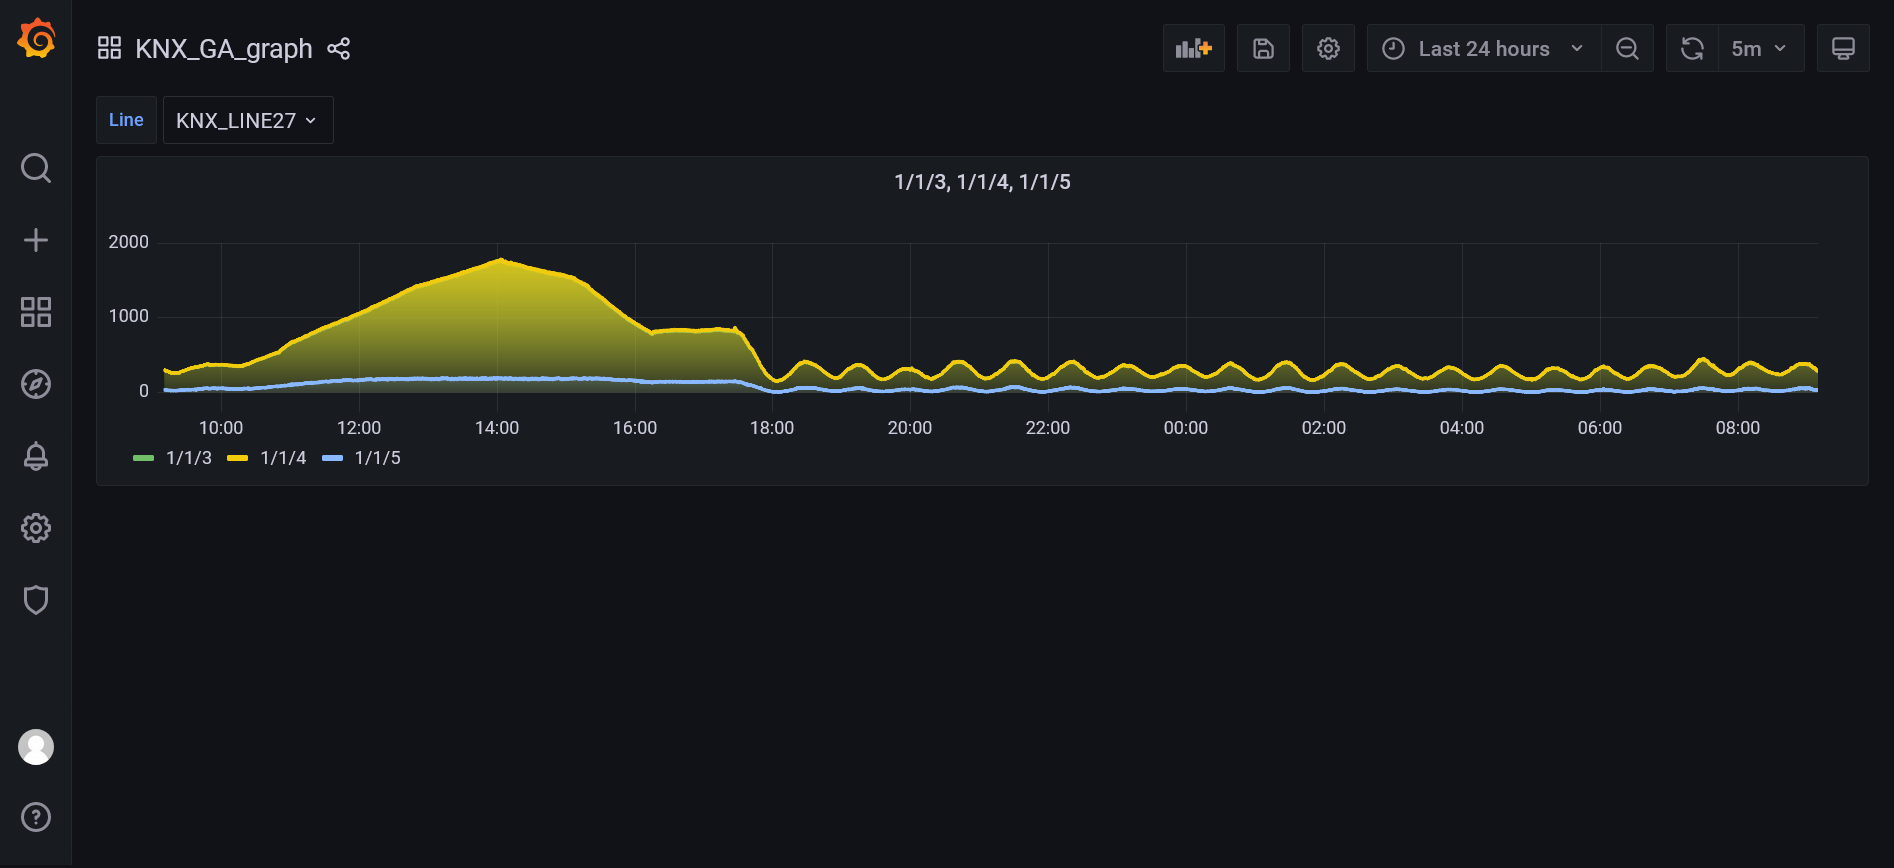
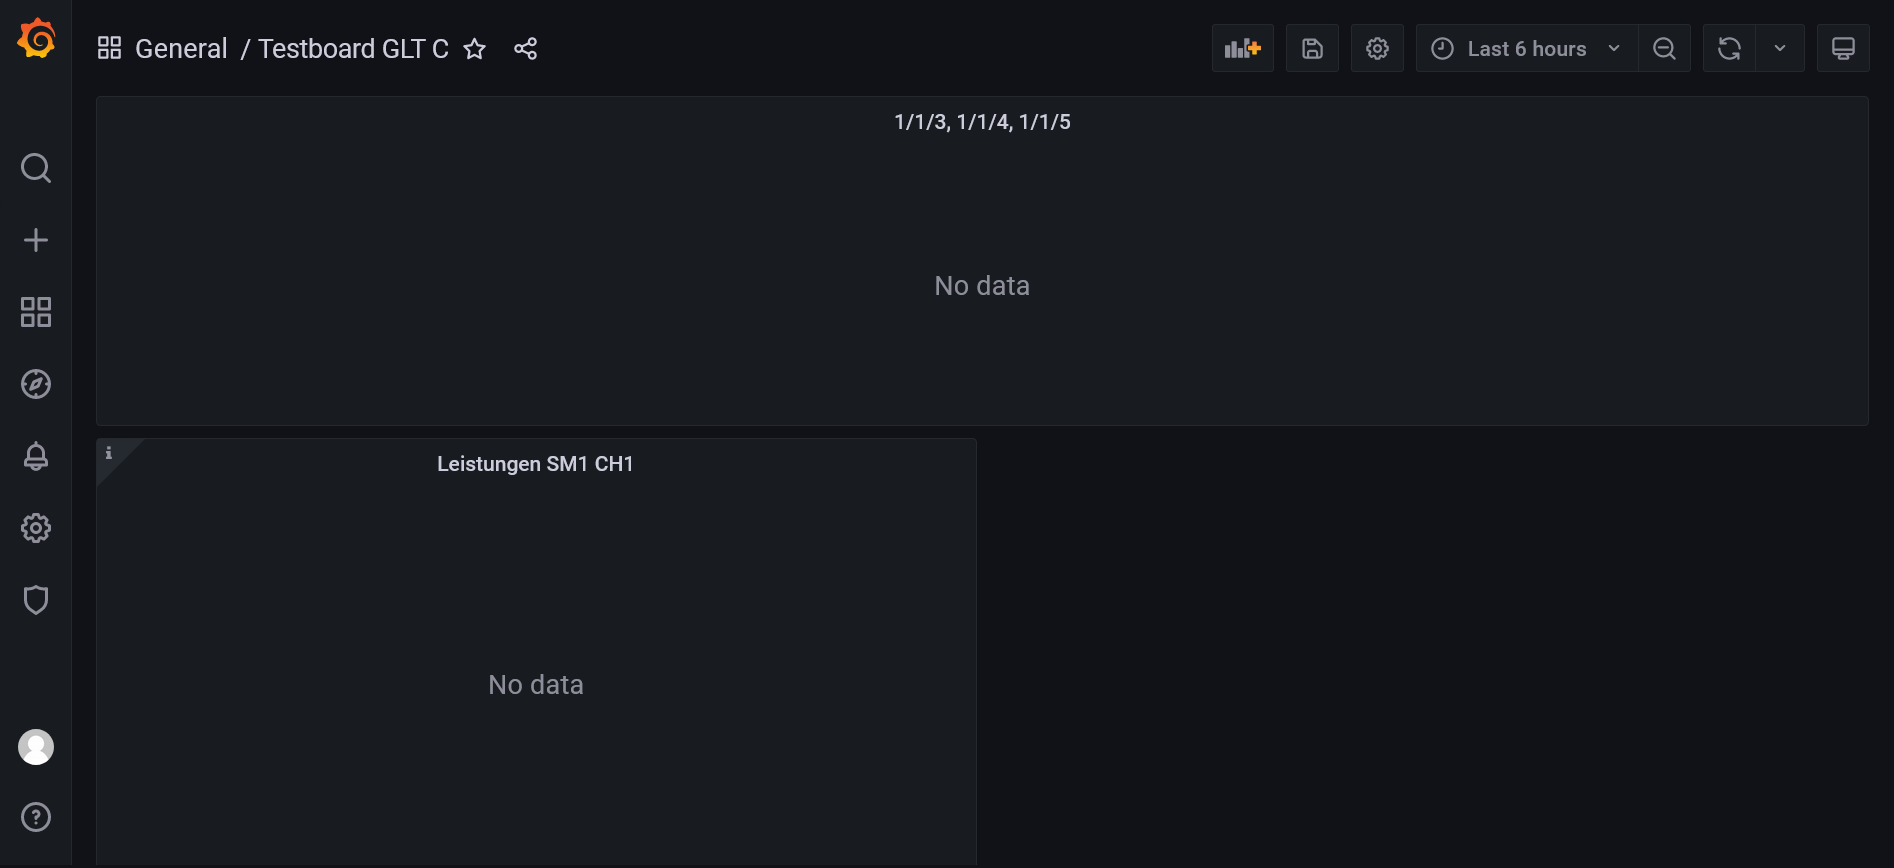
Ich versuche ein Grafana Panel zu reproduzieren, wenn ich es als Library Panel speicher und dann in einem Dashboard hinzufüge. Bekomme ich nur die Ansicht "no data".
Hab den JSON Code der nicht identisch war ohne Erfolg manuell übertragen.
Habe im Forum gelesen dass man den Query Inspector nutzen soll:
https://community.grafana.com/t/created ... ta/53977/3
Bei mir siehts so aus: Query inspector
Query inspector allows you to view raw request and response. To collect this data Grafana needs to issue a new query. Click refresh button below to trigger a new query.
A:8540 rows
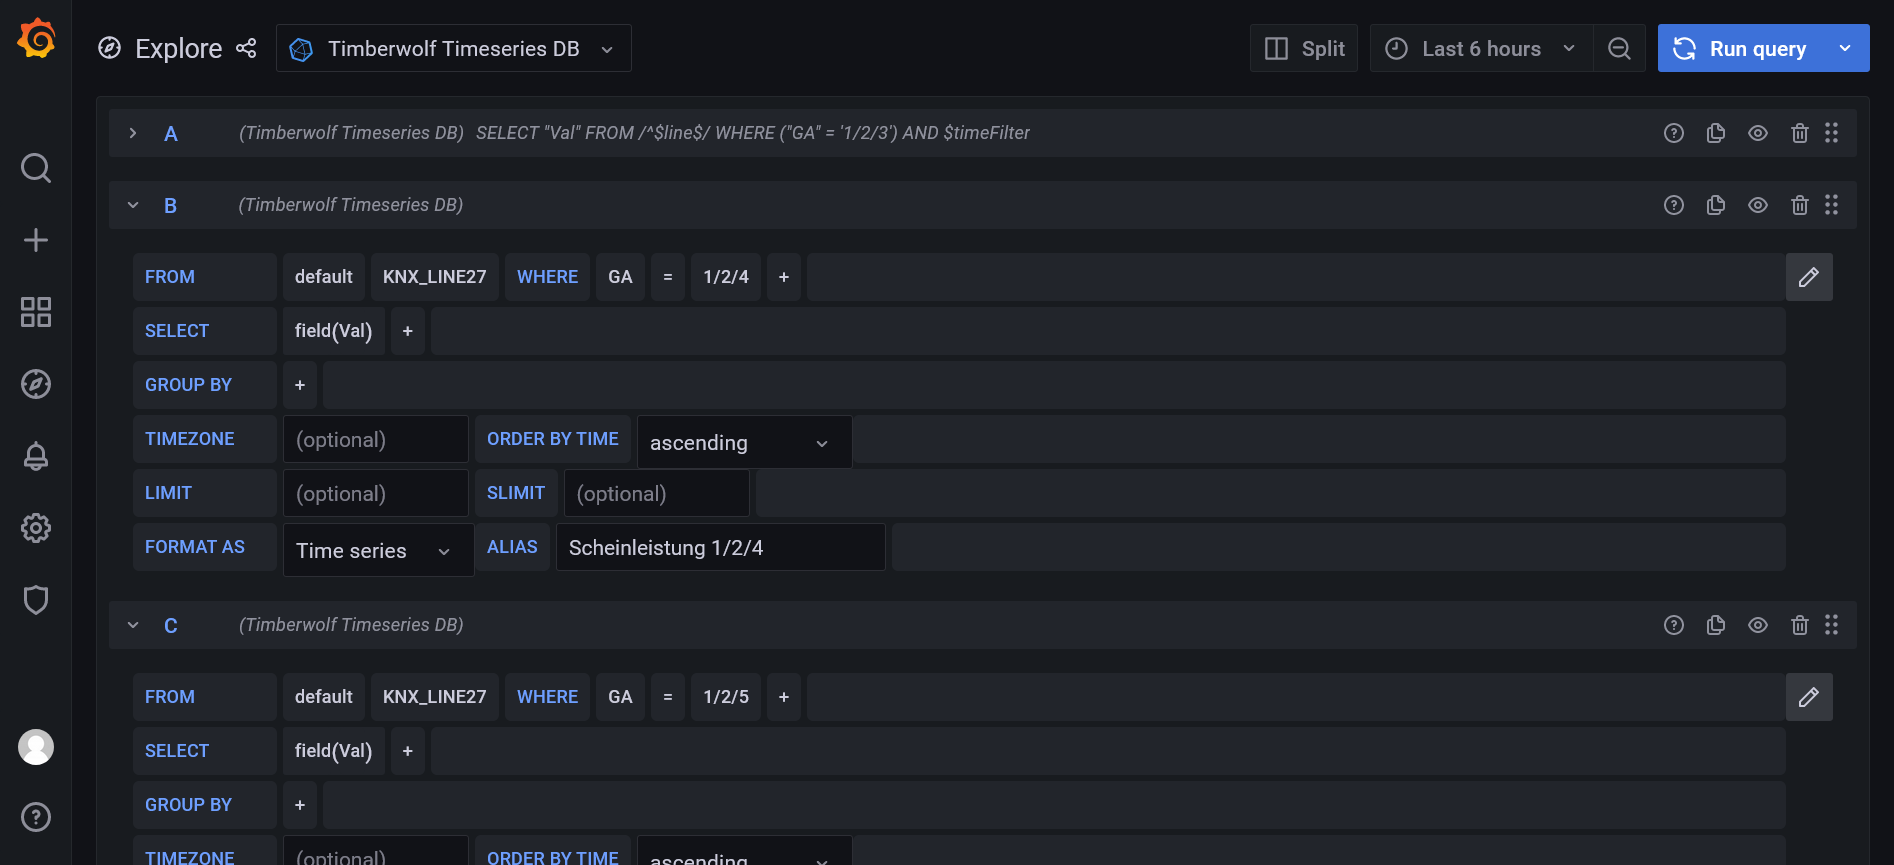
SELECT "Val" FROM /^KNX_LINE27$/ WHERE ("GA" = '1/2/3') AND time >= now() - 24h and time <= now();SELECT "Val" FROM /^KNX_LINE27$/ WHERE ("GA" = '1/2/4') AND time >= now() - 24h and time <= now();SELECT "Val" FROM /^KNX_LINE27$/ WHERE ("GA" = '1/2/5') AND time >= now() - 24h and time <= now()
B:8541 rows
SELECT "Val" FROM /^KNX_LINE27$/ WHERE ("GA" = '1/2/3') AND time >= now() - 24h and time <= now();SELECT "Val" FROM /^KNX_LINE27$/ WHERE ("GA" = '1/2/4') AND time >= now() - 24h and time <= now();SELECT "Val" FROM /^KNX_LINE27$/ WHERE ("GA" = '1/2/5') AND time >= now() - 24h and time <= now()
C:44041 rows
SELECT "Val" FROM /^KNX_LINE27$/ WHERE ("GA" = '1/2/3') AND time >= now() - 24h and time <= now();SELECT "Val" FROM /^KNX_LINE27$/ WHERE ("GA" = '1/2/4') AND time >= now() - 24h and time <= now();SELECT "Val" FROM /^KNX_LINE27$/ WHERE ("GA" = '1/2/5') AND time >= now() - 24h and time <= now()
Diese Elemente werden mir im neuen Dashboard nicht angezeigt!
und unten den Code...
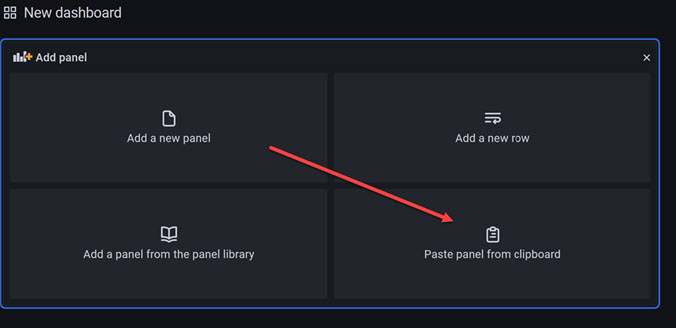
Wenn ich den den Copy to Clipboard Button nutze, wo kann ich das dann im neu erstellten Dashboard hinzufügen?
Query Inspector (neues Dashboard):
{
"request": {
"method": "POST",
"url": "api/datasources/proxy/4/query",
"params": {
"db": "timeseries_db",
"epoch": "ms"
},
"data": "q=SELECT%20%22Val%22%20FROM%20%2F%5E%24line%24%2F%20WHERE%20(%22GA%22%20%3D%20'1%2F2%2F3')%20AND%20time%20%3E%3D%20now()%20-%206h%20and%20time%20%3C%3D%20now()%3BSELECT%20%22Val%22%20FROM%20%2F%5E%24line%24%2F%20WHERE%20(%22GA%22%20%3D%20'1%2F2%2F4')%20AND%20time%20%3E%3D%20now()%20-%206h%20and%20time%20%3C%3D%20now()%3BSELECT%20%22Val%22%20FROM%20%2F%5E%24line%24%2F%20WHERE%20(%22GA%22%20%3D%20'1%2F2%2F5')%20AND%20time%20%3E%3D%20now()%20-%206h%20and%20time%20%3C%3D%20now()",
"precision": "ms",
"hideFromInspector": false
},
"response": {
"results": [
{
"statement_id": 0
},
{
"statement_id": 1
},
{
"statement_id": 2
}
],
"executedQueryString": "SELECT \"Val\" FROM /^$line$/ WHERE (\"GA\" = '1/2/3') AND time >= now() - 6h and time <= now();SELECT \"Val\" FROM /^$line$/ WHERE (\"GA\" = '1/2/4') AND time >= now() - 6h and time <= now();SELECT \"Val\" FROM /^$line$/ WHERE (\"GA\" = '1/2/5') AND time >= now() - 6h and time <= now()"
}
}
Ich versuche ein Grafana Panel zu reproduzieren, wenn ich es als Library Panel speicher und dann in einem Dashboard hinzufüge. Bekomme ich nur die Ansicht "no data".
Hab den JSON Code der nicht identisch war ohne Erfolg manuell übertragen.
Habe im Forum gelesen dass man den Query Inspector nutzen soll:
https://community.grafana.com/t/created ... ta/53977/3
Bei mir siehts so aus: Query inspector
Query inspector allows you to view raw request and response. To collect this data Grafana needs to issue a new query. Click refresh button below to trigger a new query.
A:8540 rows
SELECT "Val" FROM /^KNX_LINE27$/ WHERE ("GA" = '1/2/3') AND time >= now() - 24h and time <= now();SELECT "Val" FROM /^KNX_LINE27$/ WHERE ("GA" = '1/2/4') AND time >= now() - 24h and time <= now();SELECT "Val" FROM /^KNX_LINE27$/ WHERE ("GA" = '1/2/5') AND time >= now() - 24h and time <= now()
B:8541 rows
SELECT "Val" FROM /^KNX_LINE27$/ WHERE ("GA" = '1/2/3') AND time >= now() - 24h and time <= now();SELECT "Val" FROM /^KNX_LINE27$/ WHERE ("GA" = '1/2/4') AND time >= now() - 24h and time <= now();SELECT "Val" FROM /^KNX_LINE27$/ WHERE ("GA" = '1/2/5') AND time >= now() - 24h and time <= now()
C:44041 rows
SELECT "Val" FROM /^KNX_LINE27$/ WHERE ("GA" = '1/2/3') AND time >= now() - 24h and time <= now();SELECT "Val" FROM /^KNX_LINE27$/ WHERE ("GA" = '1/2/4') AND time >= now() - 24h and time <= now();SELECT "Val" FROM /^KNX_LINE27$/ WHERE ("GA" = '1/2/5') AND time >= now() - 24h and time <= now()
Diese Elemente werden mir im neuen Dashboard nicht angezeigt!
und unten den Code...
Wenn ich den den Copy to Clipboard Button nutze, wo kann ich das dann im neu erstellten Dashboard hinzufügen?
Query Inspector (neues Dashboard):
{
"request": {
"method": "POST",
"url": "api/datasources/proxy/4/query",
"params": {
"db": "timeseries_db",
"epoch": "ms"
},
"data": "q=SELECT%20%22Val%22%20FROM%20%2F%5E%24line%24%2F%20WHERE%20(%22GA%22%20%3D%20'1%2F2%2F3')%20AND%20time%20%3E%3D%20now()%20-%206h%20and%20time%20%3C%3D%20now()%3BSELECT%20%22Val%22%20FROM%20%2F%5E%24line%24%2F%20WHERE%20(%22GA%22%20%3D%20'1%2F2%2F4')%20AND%20time%20%3E%3D%20now()%20-%206h%20and%20time%20%3C%3D%20now()%3BSELECT%20%22Val%22%20FROM%20%2F%5E%24line%24%2F%20WHERE%20(%22GA%22%20%3D%20'1%2F2%2F5')%20AND%20time%20%3E%3D%20now()%20-%206h%20and%20time%20%3C%3D%20now()",
"precision": "ms",
"hideFromInspector": false
},
"response": {
"results": [
{
"statement_id": 0
},
{
"statement_id": 1
},
{
"statement_id": 2
}
],
"executedQueryString": "SELECT \"Val\" FROM /^$line$/ WHERE (\"GA\" = '1/2/3') AND time >= now() - 6h and time <= now();SELECT \"Val\" FROM /^$line$/ WHERE (\"GA\" = '1/2/4') AND time >= now() - 6h and time <= now();SELECT \"Val\" FROM /^$line$/ WHERE (\"GA\" = '1/2/5') AND time >= now() - 6h and time <= now()"
}
}