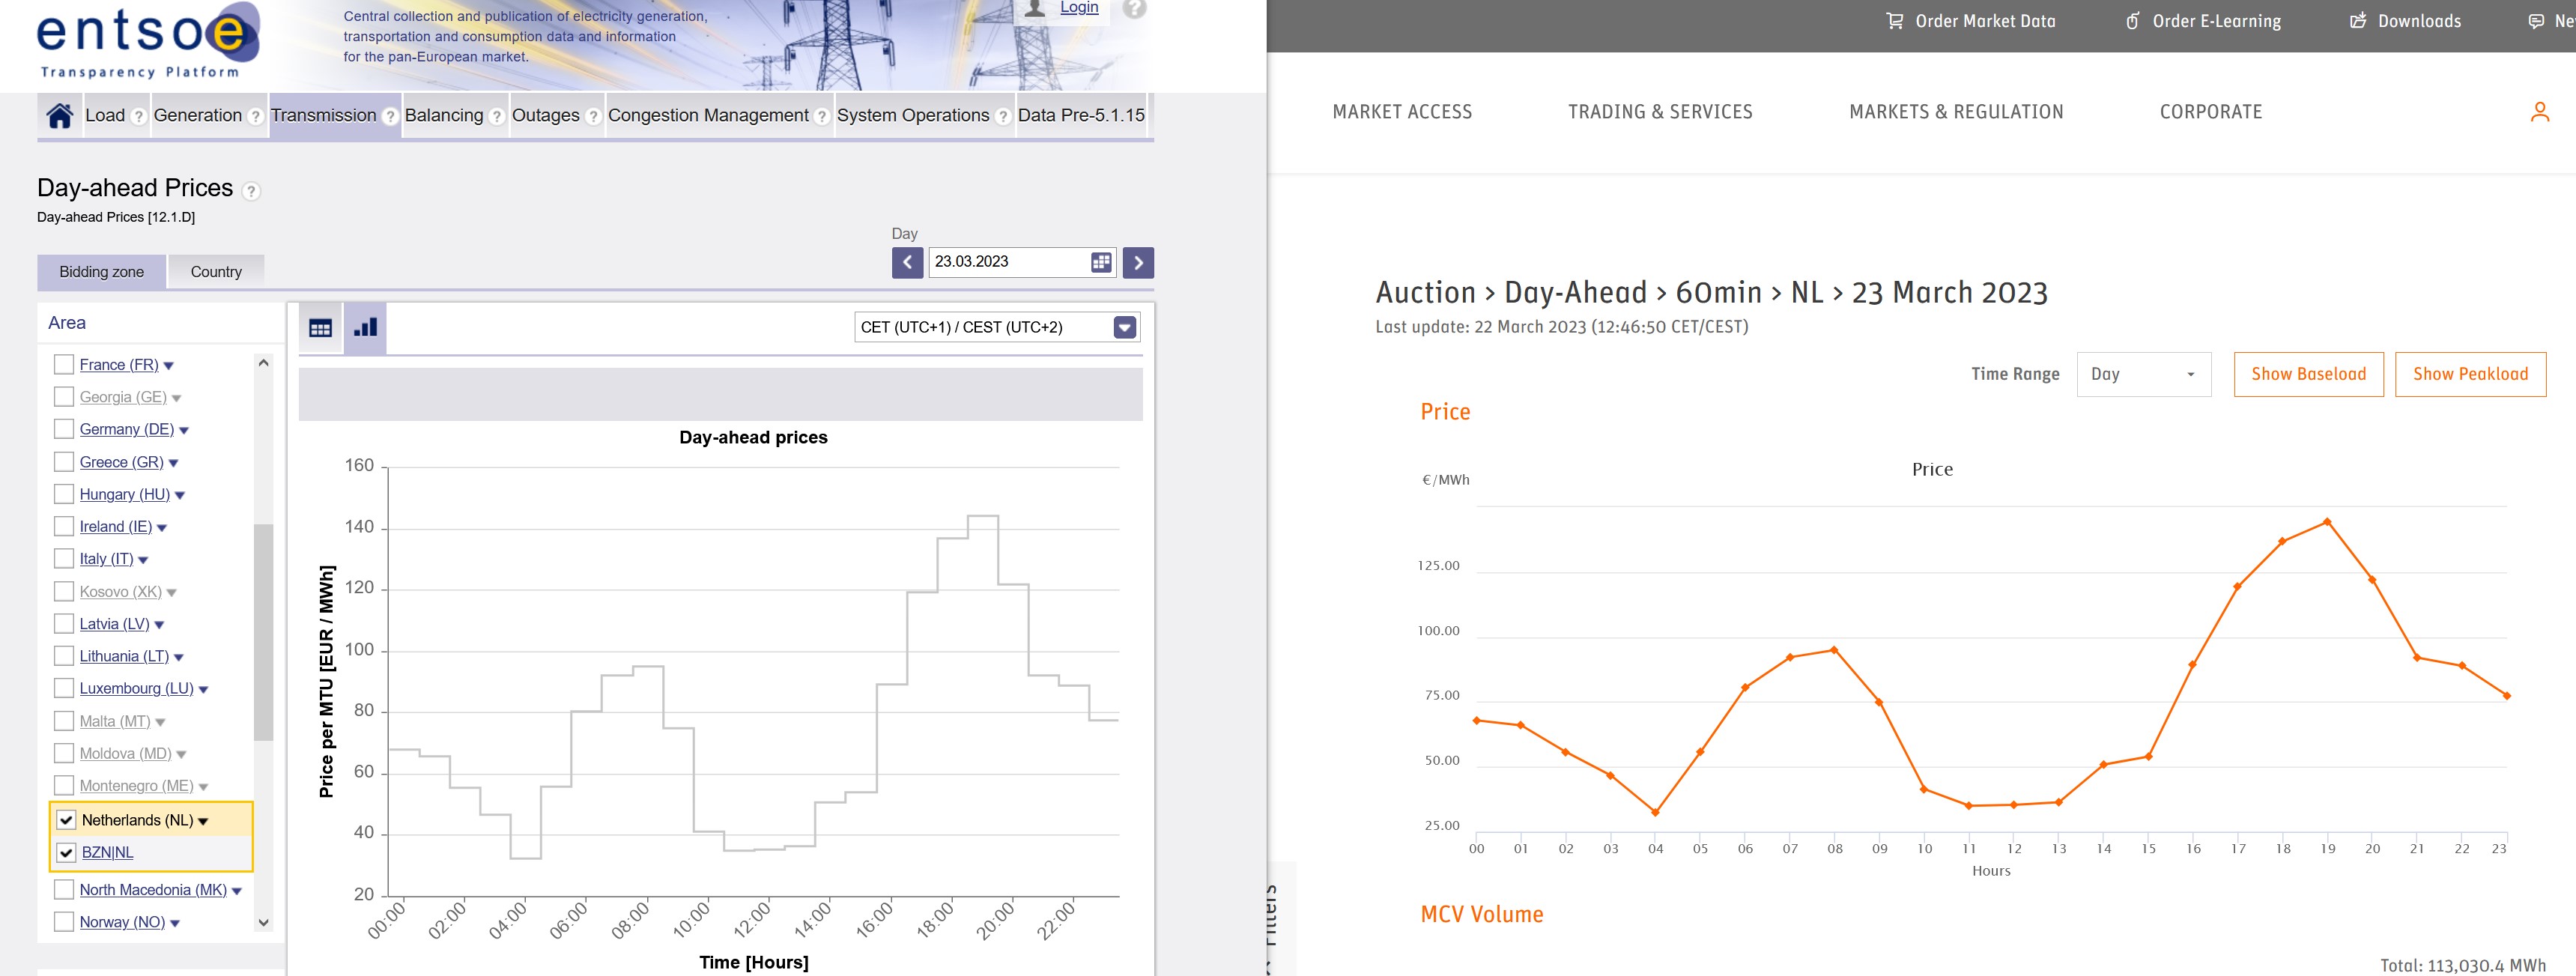
Weil wir ein Stromlieferant mit dynamische €/kWh, möchte ich die Preise vom Entso-e website herunter laden. Die https code mit API-key hat schon geklappt
https://web-api.tp.entsoe.eu/api?securi ... 2212162300
Die Datei sieht so aus wie hierunter.
Das Problem: der XML den ich zurück bekomme, hat 24 Positionen in sich (ohne Tag/Zeit label). Jedes Mal angegeben zwischen <price.amount> und </price.amount> Wie bekomme ich das zur eine Zeitserien?
Herzlichen Dank für's mitdenken.
Vincent
Code: Alles auswählen
<?xml version="1.0" encoding="UTF-8"?>
<Publication_MarketDocument xmlns="urn:iec62325.351:tc57wg16:451-3:publicationdocument:7:0">
<mRID>6485b30276564c17a9a63a67d0963936</mRID>
<revisionNumber>1</revisionNumber>
<type>A44</type>
<sender_MarketParticipant.mRID codingScheme="A01">10X1001A1001A450</sender_MarketParticipant.mRID>
<sender_MarketParticipant.marketRole.type>A32</sender_MarketParticipant.marketRole.type>
<receiver_MarketParticipant.mRID codingScheme="A01">10X1001A1001A450</receiver_MarketParticipant.mRID>
<receiver_MarketParticipant.marketRole.type>A33</receiver_MarketParticipant.marketRole.type>
<createdDateTime>2022-12-15T13:16:03Z</createdDateTime>
<period.timeInterval>
<start>2022-12-15T23:00Z</start>
<end>2022-12-16T23:00Z</end>
</period.timeInterval>
<TimeSeries>
<mRID>1</mRID>
<businessType>A62</businessType>
<in_Domain.mRID codingScheme="A01">10YNL----------L</in_Domain.mRID>
<out_Domain.mRID codingScheme="A01">10YNL----------L</out_Domain.mRID>
<currency_Unit.name>EUR</currency_Unit.name>
<price_Measure_Unit.name>MWH</price_Measure_Unit.name>
<curveType>A01</curveType>
<Period>
<timeInterval>
<start>2022-12-15T23:00Z</start>
<end>2022-12-16T23:00Z</end>
</timeInterval>
<resolution>PT60M</resolution>
<Point>
<position>1</position>
<price.amount>296.30</price.amount>
</Point>
<Point>
<position>2</position>
<price.amount>287.92</price.amount>
</Point>
<Point>
<position>3</position>
<price.amount>279.65</price.amount>
</Point>
<Point>
<position>4</position>
<price.amount>270.10</price.amount>
</Point>
<Point>
<position>5</position>
<price.amount>256.00</price.amount>
</Point>
<Point>
<position>6</position>
<price.amount>272.60</price.amount>
</Point>
<Point>
<position>7</position>
<price.amount>319.32</price.amount>
</Point>
<Point>
<position>8</position>
<price.amount>440.90</price.amount>
</Point>
<Point>
<position>9</position>
<price.amount>543.49</price.amount>
</Point>
<Point>
<position>10</position>
<price.amount>561.64</price.amount>
</Point>
<Point>
<position>11</position>
<price.amount>543.45</price.amount>
</Point>
<Point>
<position>12</position>
<price.amount>517.08</price.amount>
</Point>
<Point>
<position>13</position>
<price.amount>453.00</price.amount>
</Point>
<Point>
<position>14</position>
<price.amount>424.05</price.amount>
</Point>
<Point>
<position>15</position>
<price.amount>452.90</price.amount>
</Point>
<Point>
<position>16</position>
<price.amount>465.14</price.amount>
</Point>
<Point>
<position>17</position>
<price.amount>478.55</price.amount>
</Point>
<Point>
<position>18</position>
<price.amount>505.00</price.amount>
</Point>
<Point>
<position>19</position>
<price.amount>490.17</price.amount>
</Point>
<Point>
<position>20</position>
<price.amount>467.79</price.amount>
</Point>
<Point>
<position>21</position>
<price.amount>392.91</price.amount>
</Point>
<Point>
<position>22</position>
<price.amount>334.15</price.amount>
</Point>
<Point>
<position>23</position>
<price.amount>306.75</price.amount>
</Point>
<Point>
<position>24</position>
<price.amount>280.00</price.amount>
</Point>
</Period>
</TimeSeries>
</Publication_MarketDocument>